A visual representation of data that shows the relationship between different variables or values. SWRM graphs take the average of a Sensor it is reading and plot it over a selected time period. This information is designed to make it easier to understand large sets of information at a glance and look for trends.
Graphs can be displayed in one of two ways:
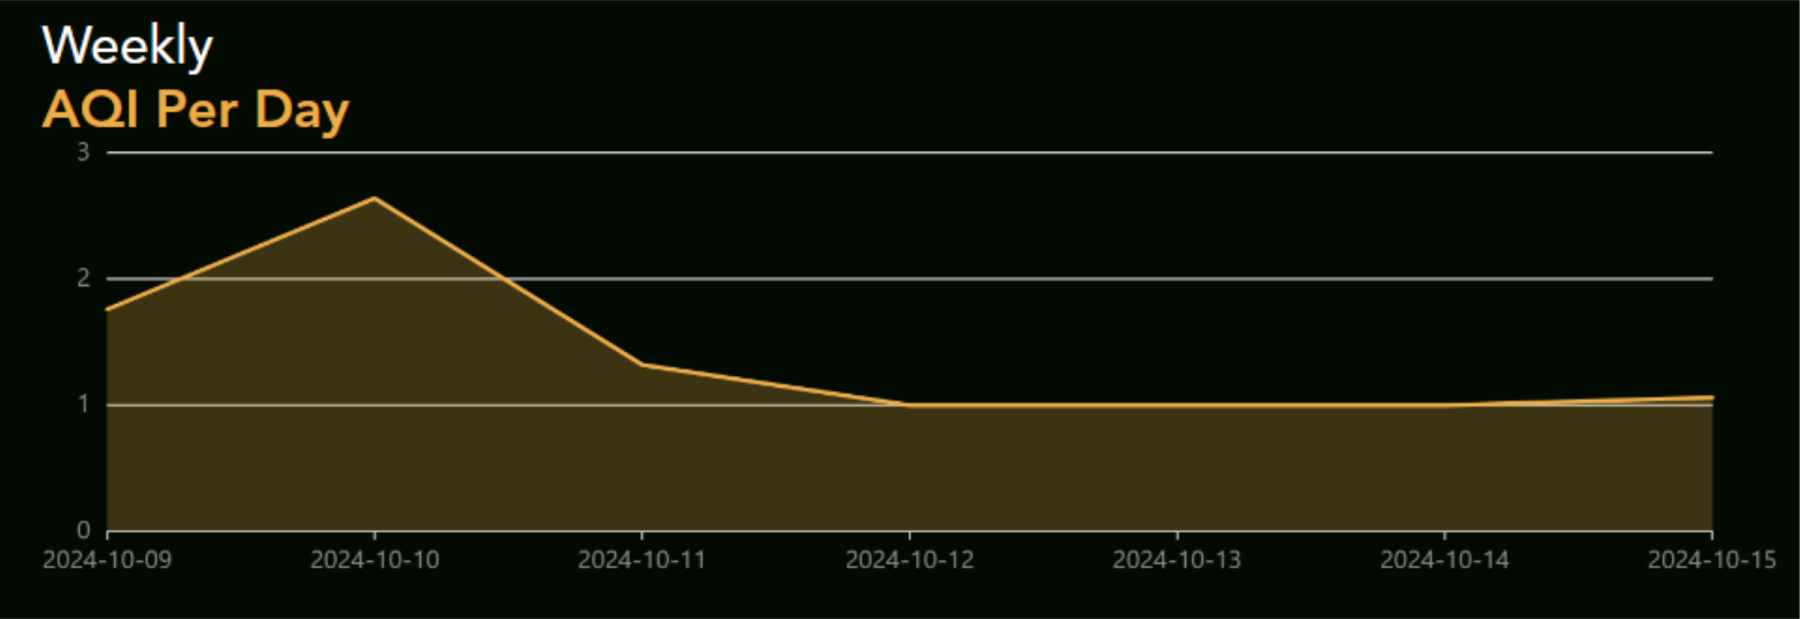
- Line graph:
- Used when measuring averages.
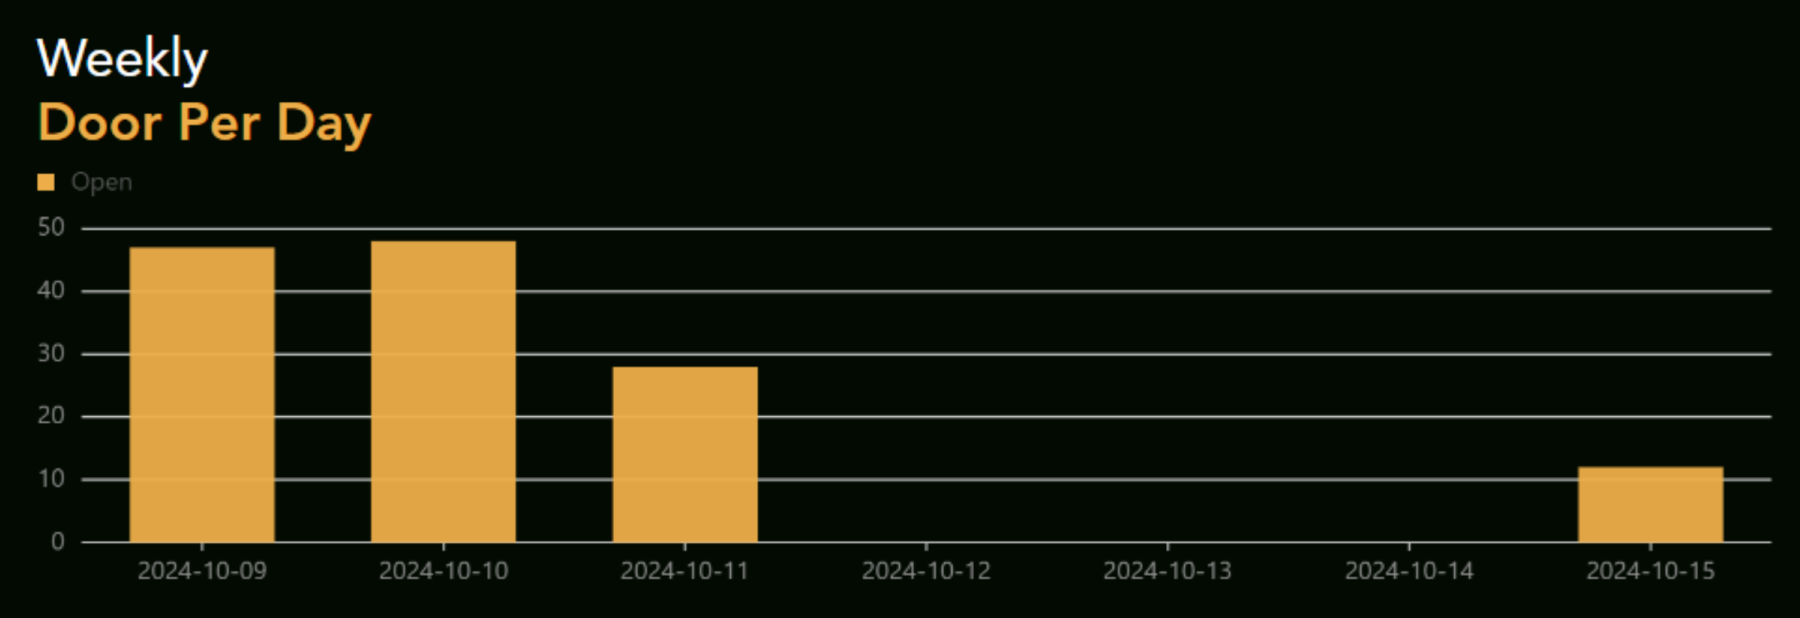
- Bar graph:
- Used when counting or measuring a quantity of something.